
11 November 2026 · Commentary
Fast Economy, Flat Index: India’s Reverse DAX Paradox
Why a market can stall while its economy races, and whether foreign direct investors should care.
Market vs. Macro · Data to 11 November 2026
On 11 November the Nifty 50 closed at 25,255.05. It began the year at 26,129.60, so after more than ten months it is still about 3% down. That is the better version of the story. In the middle of October the index was down almost 14% for the year, and it has only climbed back in the last few weeks. On 31 August, meanwhile, the statistics ministry reported that India’s economy grew 7.8% in April to June, comfortably ahead of what economists had pencilled in, with investment spending up almost 12%.
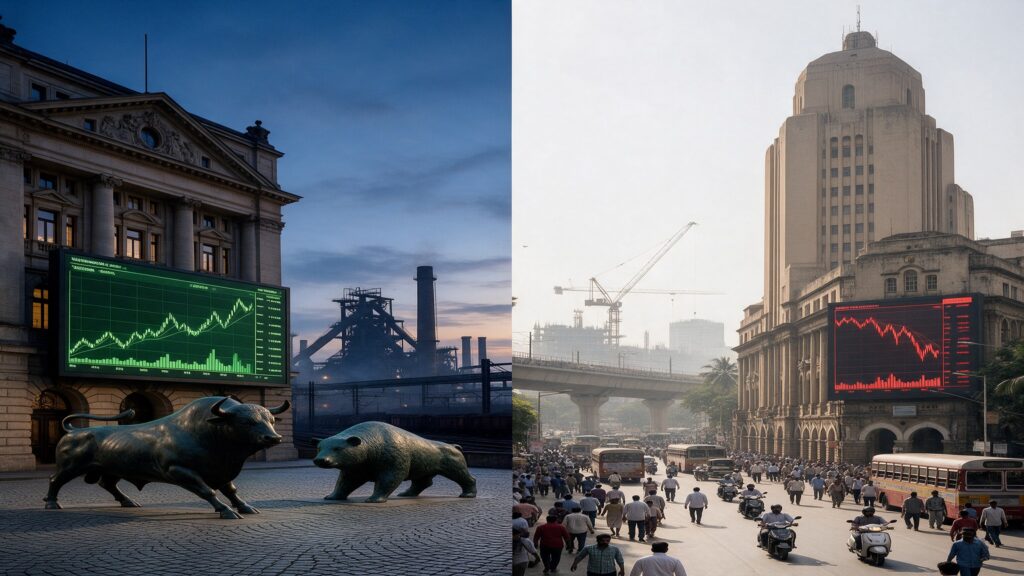
I have just finished writing about Germany, where the DAX keeps setting records over an economy that has barely grown since 2022 (the companion piece, The DAX Paradox, is on this site). India is the same puzzle the other way round. Germany has a market running ahead of its economy; India has an economy running ahead of its market. My first instinct was that the German explanation would simply apply in reverse. It doesn’t, quite.
Why the German answer doesn’t fit
The best single explanation for the DAX is that its companies are German by address only. Roughly 82% of DAX constituents’ sales are earned abroad, so Siemens and SAP can prosper while Duisburg doesn’t.
The Nifty has no such excuse. Apart from the IT services companies, the index is overwhelmingly a bet on Indian borrowers, Indian consumers, Indian fuel demand and Indian telecom subscribers. If any large-cap index in the world ought to track its home economy, it is this one. And yet over the past two years the two lines have pulled apart about as sharply as Germany’s did, in the opposite direction.
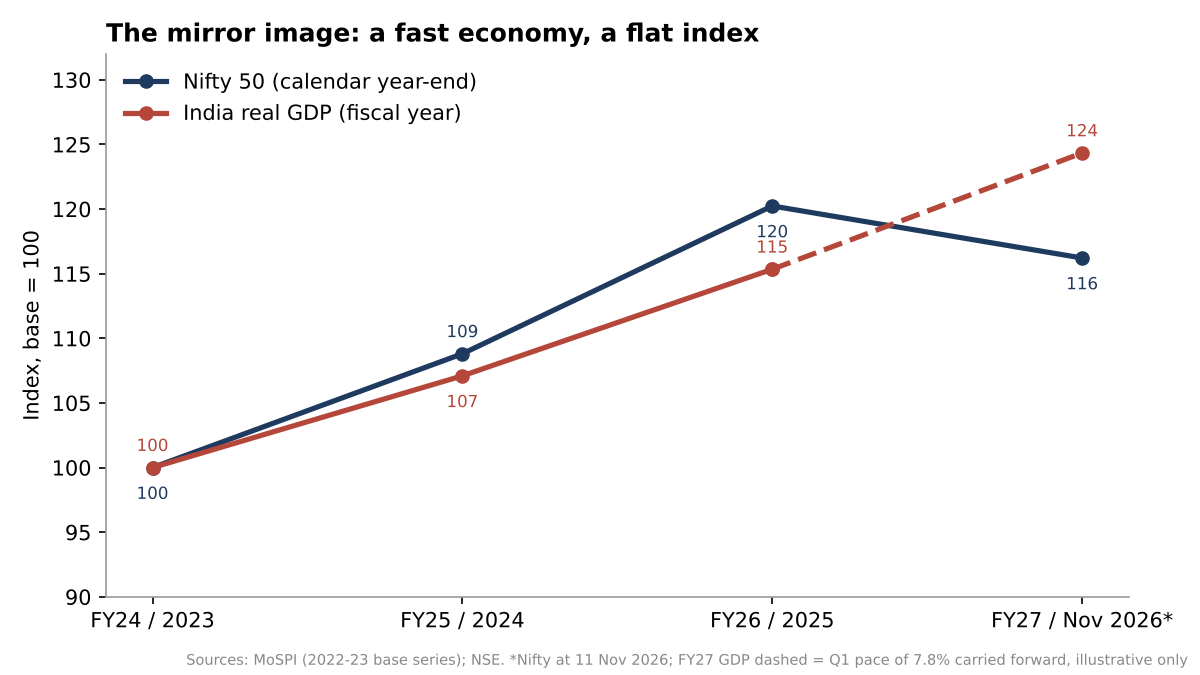
So for India the question is a different one. Why did the growth take so long to reach the fifty companies that are supposed to represent it, and why did the market not believe it even when it arrived?
For a while, the growth wasn’t inside the index
This is the part that surprised me most when I went through the numbers. A Business Standard analysis of the January to March 2026 quarter found that adjusted net profit for the Nifty 50 companies grew 4.5% year on year, the eighth quarter in a row of single-digit growth. Across all 3,081 listed companies in the same sample, profit grew 15.1%. The Nifty’s share of total listed profit fell to 47.1%, the lowest in at least 21 quarters and well down from a peak of 58.3% at the end of 2022.
Where did the profit growth go instead? A good part of it went to companies such as Indian Oil and LIC, which are listed but not in the Nifty 50, and to public sector banks, NBFCs and metal companies that are underrepresented in the index. The analyst Dhananjay Sinha pointed out in that same report that BFSI, consumer goods and IT services together make up about 60% of the Nifty’s weight, and all three had been weak. Financial services alone is 37% of the index. Capital goods, the sector you would expect to ride a capex cycle, is 1.2%. Power is 2.5%, construction a little over 4%.
There is a symmetry with Germany here, and it runs backwards. The DAX escaped its sick sectors: carmakers have shrunk to the margins of the index, and the weight has moved to grid equipment, software and insurance. The Nifty is stuck with its tired ones. It is weighted towards the credit-and-consumption India of the last decade, while the growth of 2026 is coming from public investment, construction, power and a great deal of activity in firms that aren’t in the index or aren’t listed at all. GDP counts all of that. The Nifty sees very little of it.
I have to concede that the earnings picture has changed since spring. In April to June, Nifty 50 profits grew 18%, the best in ten quarters, according to Motilal Oswal. For July to September, the 35 index companies that had reported by the end of October showed growth of 22%. Much of that came from a handful of names: Reliance, JSW Steel, ICICI Bank, Coal India and Axis Bank accounted for 59% of the increase. And the broader market is still growing faster. Across the 230 companies the same brokerage had tracked by then, profits were up 33%.
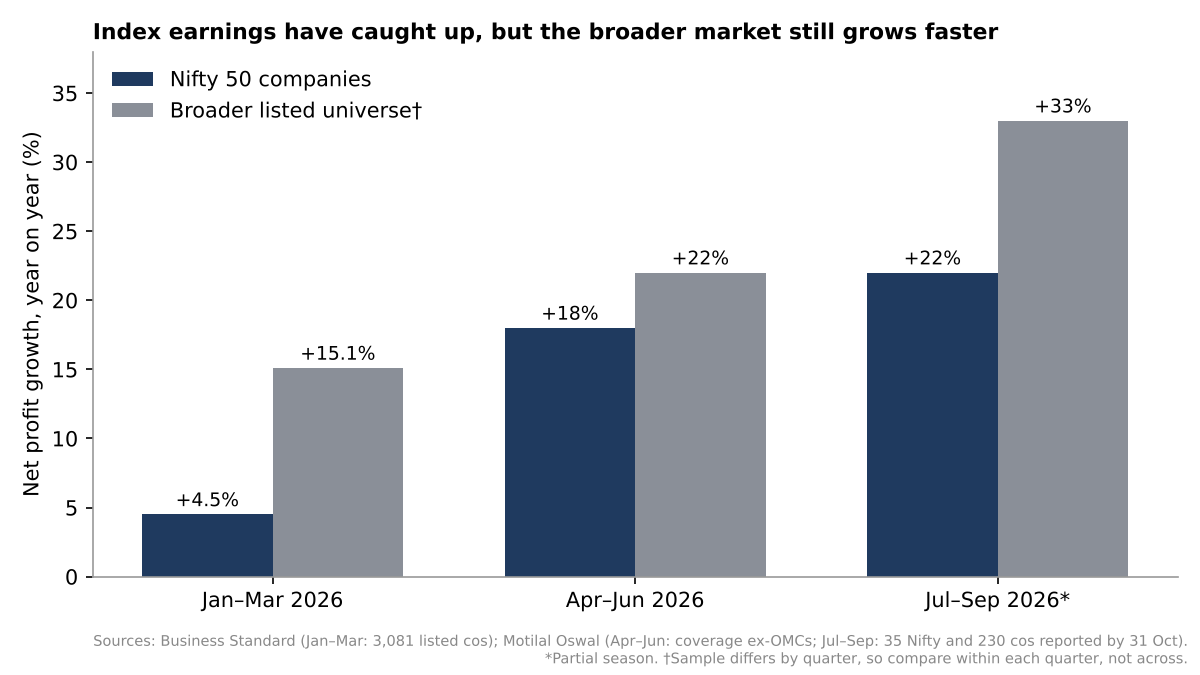
So the gap has narrowed without closing. What I find more telling is how the index behaved while earnings recovered. In August and September, with the April to June profits out and up 18%, the Nifty fell in both months. Whatever was setting the price that summer, it wasn’t the profit numbers.
The price you paid, and who was selling
The second reason is less interesting but probably matters more over a year like this one. India went into 2025 expensive. The DAX went in at about 13 times forward earnings, cheap against the US, and simply got re-rated upward; India got re-rated downward. On 19 October the Nifty’s trailing P/E was 19.33, roughly 12% below its five-year median of about 22. Even after the recent rally it was 20.48 on 9 November, still under that median. Earnings didn’t collapse. Investors stopped paying the old premium for them.
The people who stopped paying were mostly foreign. By the middle of October, foreign portfolio investors had pulled more than ₹3 trillion out of Indian equities in 2026, a record, against ₹1.66 trillion in all of 2025. You don’t have to look far for the reasons. The US 10-year yield breached 5.2% in October, which makes a risk-free dollar return attractive enough on its own. Brent crude was around $105 a barrel in mid-October, with the West Asia war that began on 28 February still hanging over supply, and India imports about 88% of its oil. The rupee touched an all-time low of 96.90 to the dollar in May and was still near 95 in late October.
Then there is AI. India has very few listed ways to play the chip-and-hardware boom, and global money went to where those plays are. Korea’s Kospi rose 72% in 2025. In the twelve months to early August this year, Korea’s benchmark was up roughly 90% and Taiwan’s about 80%, while India’s was down 5%. India’s underperformance against the MSCI Emerging Markets index in 2025 was the worst since 1993. Its weight in that index has fallen from about 20% in mid-2024 to somewhere between 11% and 12% this year, and passive money that tracks the index therefore needs less India.
Ownership runs the other way from Germany as well. Foreign investors own 52.6% of the DAX, so a global allocator sets the German price. In India, FPI ownership of listed equity fell to 16.13% in March 2026, a 14-year low, while domestic institutions rose to a record 19.24%. That, in my view, is why the Nifty fell 14% at its worst and not 30%.
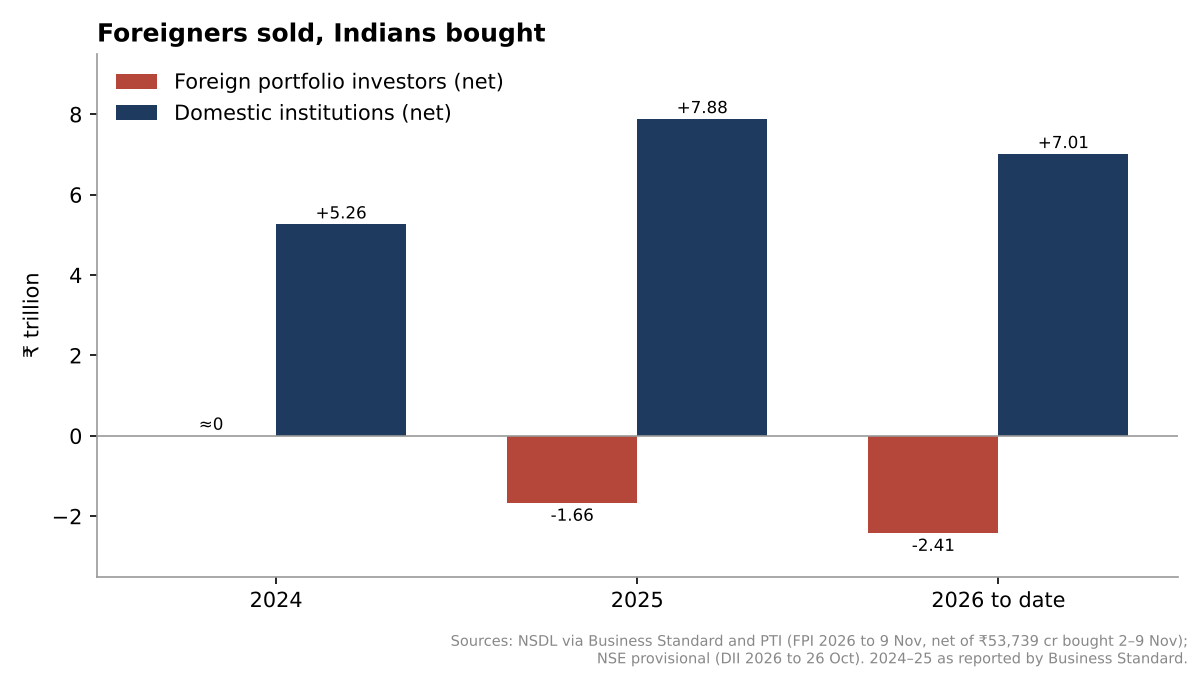
Domestic institutions had bought more than ₹7 trillion by late October, close to the ₹7.88 trillion of all of 2025. Monthly SIP contributions hit a record ₹32,490 crore in September. An analyst at Centrum put the uncomfortable corollary bluntly: strong SIP flows made it easy for foreigners to exit. They could sell in size and the market absorbed it.
What changed in November
Then, in the first week of November, the AI trade cracked. After the US midterm elections on 3 November, markets began to price tighter rules on AI data centres. Between 2 and 6 November, by Business Standard’s tally, the Nasdaq 100 fell 3.6%, Korea’s Kospi 13.6% and Taiwan’s benchmark 11.6%. SK Hynix lost almost a quarter of its value. The Nifty rose 6.8% in the same week.
What had hurt India for eighteen months suddenly helped it, because a market with little AI hardware exposure looked like a place to hide. Foreign investors bought a net ₹53,739 crore of Indian equities between 2 and 9 November, after selling ₹34,843 crore in October. Brent fell sharply on hopes of a US-Iran settlement and was around $92 by 11 November. The rupee recovered to 93.70 on 9 November, a six-month high. The year’s net foreign outflow is now about ₹2.41 trillion, still large but well off its peak.
I would not read too much into one good fortnight. Money that arrives because something went wrong somewhere else can leave just as quickly. But the fortnight is a fair test. No new GDP figure came out that week, and most of the index had already reported its September-quarter results. What changed was who wanted to buy. The slump was mostly about flows, and so far the recovery has been too.
Too much paper
One more factor rarely gets mentioned, and it connects to the FDI question. In 2025, 103 companies raised a record ₹1.75 trillion through IPOs on the main board. Every rupee of that is new equity that domestic savings have to absorb before they can lift existing share prices. A good deal of it was existing owners selling rather than fresh capital. Foreign parents have repatriated close to $5 billion through Indian listings of their subsidiaries since 2024, with Hyundai and LG Electronics accounting for more than 80% of it.
Finance has known about this for a while. Jay Ritter’s 2005 work on economic growth and equity returns found the relationship across countries was, if anything, negative. The usual explanation is dilution: much of a growing economy’s growth comes from firms that list later, or never, and the new shares they issue dilute the returns of those already holding.
India is not the only one
China is the textbook case. By 2021 its economy had grown at an average of 8.7% a year since 2000, against 1.8% for the US. Yet over the ten years to 2021, Morningstar’s China index returned about 9.4% a year against 16.8% for its US equivalent. Barriers to foreign investors, trade disputes and the constant risk of a sudden regulatory crackdown kept a discount on Chinese shares however fast the economy grew. A Morningstar test across 41 countries between 1988 and 2015 found only a weak, slightly negative link between real GDP growth and stock returns, with China sitting at the far end of the chart: high growth, poor returns.
The US has had its own version. The Dow stood at about 990 in January 1966 and at about 990 again in December 1982, sixteen years later, through a period in which the American economy kept growing in nominal terms and inflation ran wild. Over that stretch American shares roughly broke even after inflation, and most of what investors earned came from dividends rather than prices.
Germany, of course, is the reverse case, and it is running right now. A stock index measures the expected future profits of a specific set of companies, at a price someone is willing to pay today. GDP measures what a whole country produced last quarter. The two are related, but nothing in either definition says they should move together over any period an investor actually cares about.
Is it a spoiler for FDI?
Let me concede the worrying-looking number first. Net FDI into India was $28 billion in FY23. It fell to about $1 billion in FY25 and recovered only to $7.7 billion in FY26. Read the headlines alone and it looks as if foreign companies are giving up on India at the same moment the stock market did.
The gross figure is another matter. Gross inflows reached a record $94.5 billion in FY26, and India ranked second in the world, behind only the US, for greenfield FDI announcements. The net figure is small because $53.6 billion went out as repatriation and disinvestment, and another $33.3 billion went out as Indian companies investing abroad. MUFG’s research points out that repatriation has roughly doubled since 2021, to around $40 billion a year, and that it historically tracks equity deal values, IPOs included. The hot Indian market of 2023 and 2024 was itself a large part of the reason the net FDI number looked so weak. Private equity funds and foreign parents sold because valuations were rich.
Which means, a little perversely, that a cooler market should in time slow the exits. It is too early to say that is happening. Repatriation in April to August this year was $23.4 billion, roughly last year’s pace. Net FDI has picked up anyway, to $13.8 billion over those five months from $9.6 billion a year earlier, because gross inflows rose by a fifth, to $54.9 billion.
So for the investor who builds a plant, my answer is no, it isn’t a spoiler. A German Mittelstand board weighing a factory in Pune or Chennai looks at the customer base, labour, logistics, tariffs and the rule of law over ten or fifteen years. The Nifty’s quarter is not on the agenda.
It is a spoiler for something else, though, and that something is not trivial. Much private equity and venture capital money is counted as FDI, and those funds invest on the strength of the exit they expect. A de-rated market and a weak rupee shrink that exit in dollar terms, and that feeds back into fresh commitments. More seriously, the balance of payments needs these flows. In April to June, the current account deficit was $4.2 billion, portfolio investors took out $9.6 billion, and reserves fell by $8.1 billion on a balance-of-payments basis. A country running a current account deficit cannot be relaxed about portfolio money leaving at the same time, however healthy the direct investment numbers look. The pressure from a weak market lands mostly on the rupee, and much less on anyone deciding where to build.
What can be done
Not all of this is in India’s hands. Nobody in New Delhi sets US Treasury yields or the price of Brent. Some of it is, though.
First, predictability on tax. India raised long-term capital gains tax on listed equity from 10% to 12.5% and short-term from 15% to 20% from 23 July 2024. The government is now reported to be weighing a cut ahead of the 2027-28 Budget, and the Finance Minister said on 13 October that she was open to hearing views on removing the tax altogether. A cut would help at the margin. The promise to leave the rate alone afterwards would help more. When a dollar investor can earn around 5% risk-free at home, every unexpected change in India’s tax treatment gets priced as a risk premium. I’d take stability over generosity here.
Second, finish the trade deal. The framework announced with Washington on 6 February would have set the US tariff on Indian goods at 18%, but it was never applied. On 20 February the US Supreme Court ruled that the law it rested on does not authorise tariffs, and since 24 July most Indian goods have paid a 10% duty under Section 301 of the Trade Act instead. No agreement has been signed. Markets discount frameworks, and they discount them further when the legal ground under the tariffs keeps shifting.
Third, list more of the economy that is actually growing. Listings that raise fresh capital for manufacturing, energy and other capex-heavy businesses would, over time, change the shape of the index. Pure offer-for-sale listings, however welcome for price discovery, mostly hand domestic savings to departing owners.
Fourth, keep working on the plumbing that brings in steady foreign money. Bloomberg deferred India’s inclusion in its Global Aggregate bond index again in July, asking to see that recent reforms work in day-to-day settlement and trading. MUFG had estimated that inclusion could bring $15 to 20 billion over time. Patient fixed-income money would take some pressure off the rupee and make the next round of equity outflows less painful.
For investors, particularly German ones, the advice I gave on the DAX applies in reverse. Don’t read the Nifty 50 as India’s scorecard any more than you’d read the DAX as Germany’s. Look at the Nifty 500, the earnings of listed India as a whole, credit growth, GST collections and capex numbers.
Gaps of this size close eventually, either because the economy catches up with the market or because the market catches up with the economy. Germany is waiting on the first. In the first days of November, India’s gap began to close from the market side, and I know which of the two positions I’d rather start from. Timing is the part nobody gets right, and I won’t pretend to.
Figures are drawn from MoSPI, the RBI, NSE, NSDL and exchange data, and from reporting by Business Standard, Reuters columnists, Morningstar, Motilal Oswal and MUFG research, current to 11 November 2026. GDP figures use the new 2022-23 base series. Second-quarter GDP figures are due at the end of November. This is a personal analytical piece, not investment advice.
Sources
- Republic World / PTI, India’s GDP grows by 7.8% in Apr–Jun quarter, 31 Aug 2026; 5paisa, GDP growth rises to 7.8% in Q1 FY27: GFCF +11.9%, nominal +10.3%.
- Outlook Business, India’s GDP grows 7.8% in Q4, full-year growth at 7.7%; PIB, Revised GDP estimates and new measurement framework, 27 Feb 2026: FY25 7.1%.
- Social News XYZ / IANS, Sensex climbs 773 points, Nifty tops 25,250: Nifty 25,255.05 on 11 Nov 2026; Zerodha, Nifty caps off 2025: 26,129.60; Stable Investor, Nifty in 2024: 23,644.8; Free Press Journal, FPIs dump ₹44,166 crore in October: Nifty down 13.87% for the year, 11 Oct 2026.
- Business Standard via Longbridge, Nifty 50 share in India Inc’s Q4FY26 earnings lowest in 21 quarters, 2 June 2026.
- Investment Guru India / Motilal Oswal, Nifty 50 profit growth hits 10-quarter high at 18% in Q1FY27, 17 Aug 2026; CNBC-TV18 via TradingView, Motilal Oswal Q2 earnings review, 2 Nov 2026.
- NSE Indices, Nifty 50 factsheet, 30 Oct 2026: sector weights.
- IndexPE, Nifty 50 PE ratio: 19.33 on 19 Oct 2026; 20.48 on 9 Nov 2026.
- Business Standard, Record FPI outflows top ₹3 trillion in CY26, 13 Oct 2026.
- Outlook Business, Indian rupee falls nearly 8% in 2026, touching record low of 96.90, 20 May 2026; Kotak Neo, Rupee hits six-month high of 93.70, 9 Nov 2026.
- Business Standard, Year-ender 2025: India stocks lag EM, Asia in worst showing in decades; Jakarta Post, Is India Asia’s ultimate anti-AI trade?, 4 Aug 2026.
- Finnovate, MSCI EM index: why India lost FPI flows to Taiwan and South Korea: 11.94% at 30 Apr 2026; Univest, India’s weight in MSCI EM index falls to 11.29%, 3 Sep 2026.
- Multibagg, FII ownership at 14-year low (Prime Database figures, March 2026); FII and DII Data, FII selling vs DII buying 2026 (NSE provisional, to 26 Oct 2026).
- Kotak Neo, SIP contributions hit record ₹32,490 crore in September 2026.
- Business Standard, US political shake-up triggers AI rout; is India the new investor darling?, 9 Nov 2026; The Hans India, AI sell-off abroad sends FPIs rushing back to Indian equities, 11 Nov 2026; Business Standard, Market live, 11 November: Brent.
- Business Standard, Fundraising stays robust in 2025 as IPOs hit records; 5paisa, Foreign firms use India IPOs to repatriate billions, 4 June 2026.
- Morningstar, Economic growth: great for everyone but investors?; Morningstar, China’s stock market lags its economy, 5 Oct 2021; A Wealth of Common Sense, Was the 1966–1982 stock market really that bad?.
- Outlook Business, Net FDI rebounds to $7.7bn in FY26; MUFG Research, IndiaPulse: Flows before growth, 16 Jan 2026; Business Standard, India’s net FDI inflows rise to $13.8 billion in April-August FY27, 23 Oct 2026; Outlook Business, India’s CAD widened to $4.2 billion in Q1 FY27, 1 Sep 2026.
- Zerodha, What changes for investors after Budget 2024; ANI, Govt mulls cutting LTCG tax on equities ahead of Budget 2027-28, 27 Oct 2026.
- ATB Legal, India–US trade deal 2026: status, tariffs and legal position, updated 22 Oct 2026; Business Today, Why Bloomberg isn’t ready to add Indian bonds yet, 31 Jul 2026.
This piece also appeared in my LinkedIn newsletter.